WebAssembly

Introduction
WebAssembly is a binary instruction format that allows developers to compile code written in languages other than JavaScript and bring it to the web in an efficient, portable package. The existing use-cases range from reusable libraries and codecs to full GUI applications. It’s been available in all browsers since 2017—for 4 years now—and has been gaining adoption since, and this year we’ve decided it’s a good time to start tracking its usage in the Web Almanac.
Methodology
For our analysis we’ve selected all WebAssembly responses from the HTTP Archive crawl on 2021-09-01 that matched either Content-Type (application/wasm) or a file extension (.wasm). Then we downloaded all of those with a script that additionally stored the URL, response size, uncompressed size and content hash in a CSV file in the process. We excluded the requests where we repeatedly couldn’t get a response due to server errors, as well as those where the content did not in fact look like WebAssembly. For example, some Blazor websites served .NET DLLs with Content-Type: application/wasm, even though those are actually DLLs parsed by the framework core, and not WebAssembly modules.
For WebAssembly content analysis, we couldn’t use BigQuery directly. Instead, we created a tool that parses all the WebAssembly modules in the given directory and collects numbers of instructions per category, section sizes, numbers of imports/exports and so on, and stores all the stats in a stats.json file. After executing it on the directory with downloads from the previous step, the resulting JSON file was imported into BigQuery and joined with the corresponding summary_requests and summary_pages tables into httparchive.almanac.wasm_stats so that each record is self-contained and includes all the necessary information about the WebAssembly request, response and module contents. This final table was then used for all further analysis in this chapter.
Using crawler requests as a source for analysis has its own tradeoffs to be aware of when looking at the numbers in this article:
- First, we didn’t have information about requests that can be triggered by user interaction. We included only resources collected during the page load.
- Second, some websites are more popular than others, but we didn’t have precise visitor data and didn’t take it into account—instead, each detected Wasm usage is treated as equal.
- Finally, in graphs like sizes we counted the same WebAssembly module used across multiple websites as unique usages, instead of comparing only unique files. This is because we are most interested in the global picture of WebAssembly usage across the web pages rather than comparing libraries to each other.
Those tradeoffs are most consistent with analysis done in other chapters, but if you’re interested in gathering other statistics, you’re welcome to run your own queries against the table httparchive.almanac.wasm_stats.
How many modules?
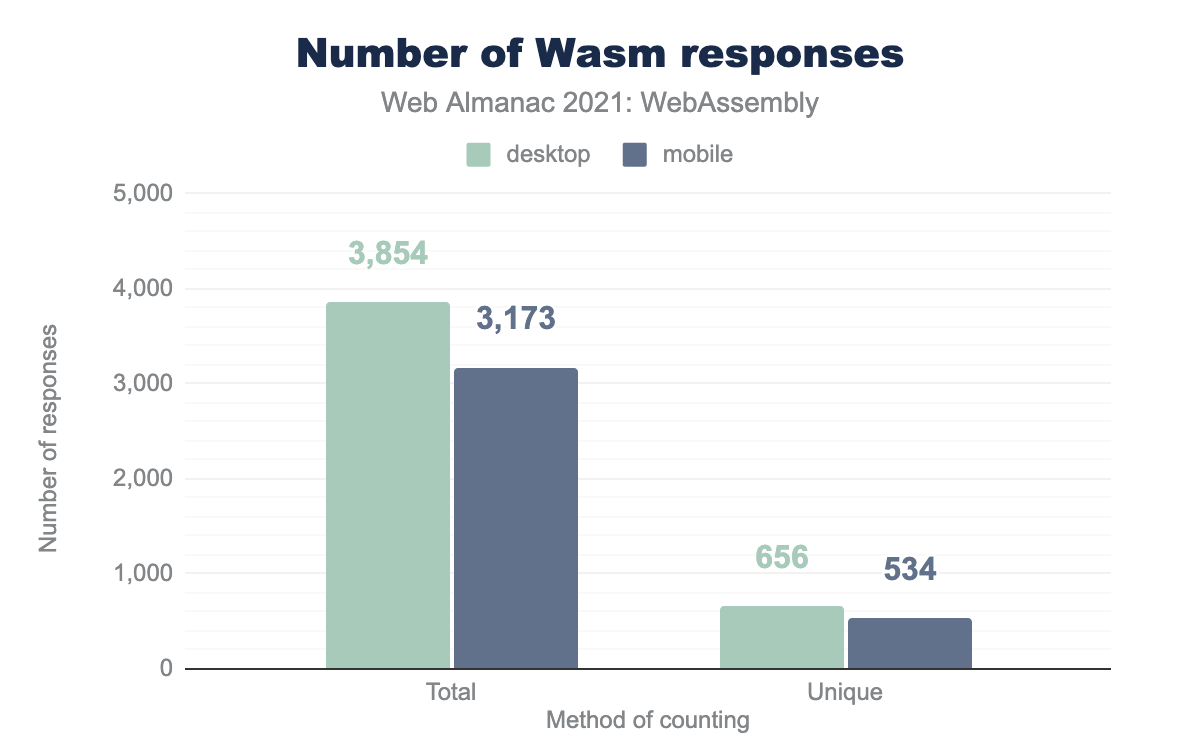
We got 3854 confirmed WebAssembly requests on desktop and 3173 on mobile. Those Wasm modules are used across 2724 domains on desktop and 2300 domains on mobile, which represents 0.06% and 0.04% of all domains on desktop and mobile correspondingly.
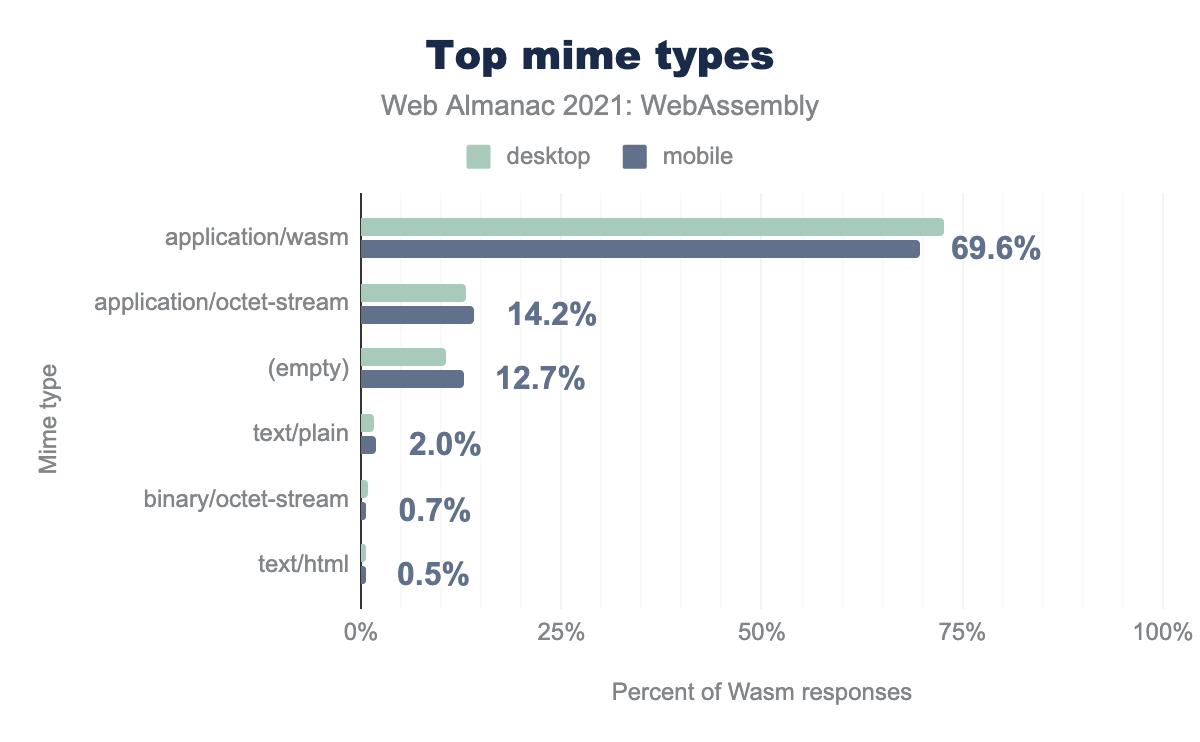
Interestingly, when we look at the most popular resulting mime-types, we can see that while Content-Type: application/wasm is by far the most popular, it doesn’t cover all the Wasm responses—good thing we included other URLs with .wasm extension too.
Some of those used application/octet-stream—a generic type for arbitrary binary data, some didn’t have any Content-Type header, and others incorrectly used text types like plain or HTML or even invalid ones like binary/octet-stream.
In case of WebAssembly, providing correct Content-Type header is important not only for security reasons, but also because it enables a faster streaming compilation and instantiation via WebAssembly.compileStreaming and WebAssembly.instantiateStreaming.
How often do we reuse Wasm libraries?
While downloading those responses, we’ve also deduplicated them by hashing their contents and using that hash as a filename on disk. After that we were left with 656 unique WebAssembly files on desktop and 534 on mobile.
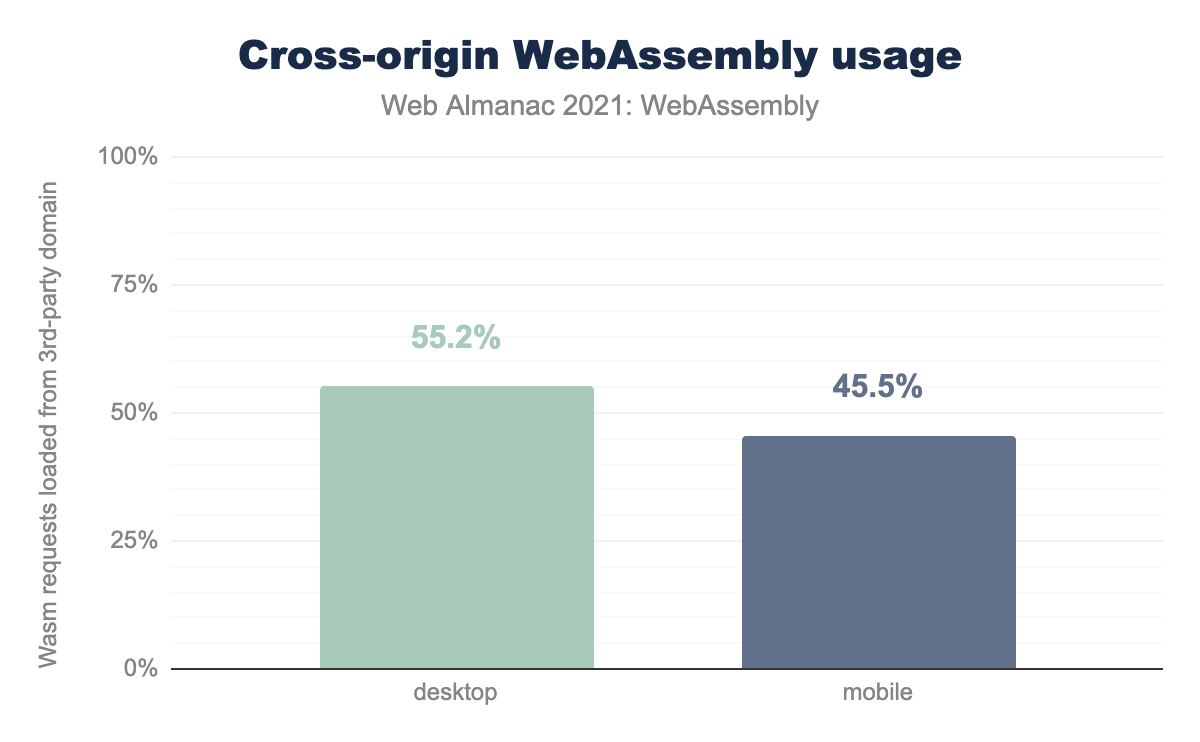
The stark difference between the numbers of unique files and total responses already suggests high reuse of WebAssembly libraries across various websites. It’s further confirmed if we look at the distribution of cross-origin / same-origin WebAssembly requests:
Let’s dive deeper and figure out what those reused libraries are. First, we’ve tried to deduplicate libraries by content hash alone, but it became quickly apparent that many of those left are still duplicates that differ only by library version.
Then we decided to extract library names from URLs. While it’s more problematic in theory due to potential name clashes, it turned out to be a more reliable option for top libraries in practice. We extracted filenames from URLs, removed extensions, minor versions, and suffixes that looked like content hashes, sorted the results by number of repetitions and extracted the top 10 modules for each client. For those left, we did manual lookups to understand which libraries those modules are coming from.
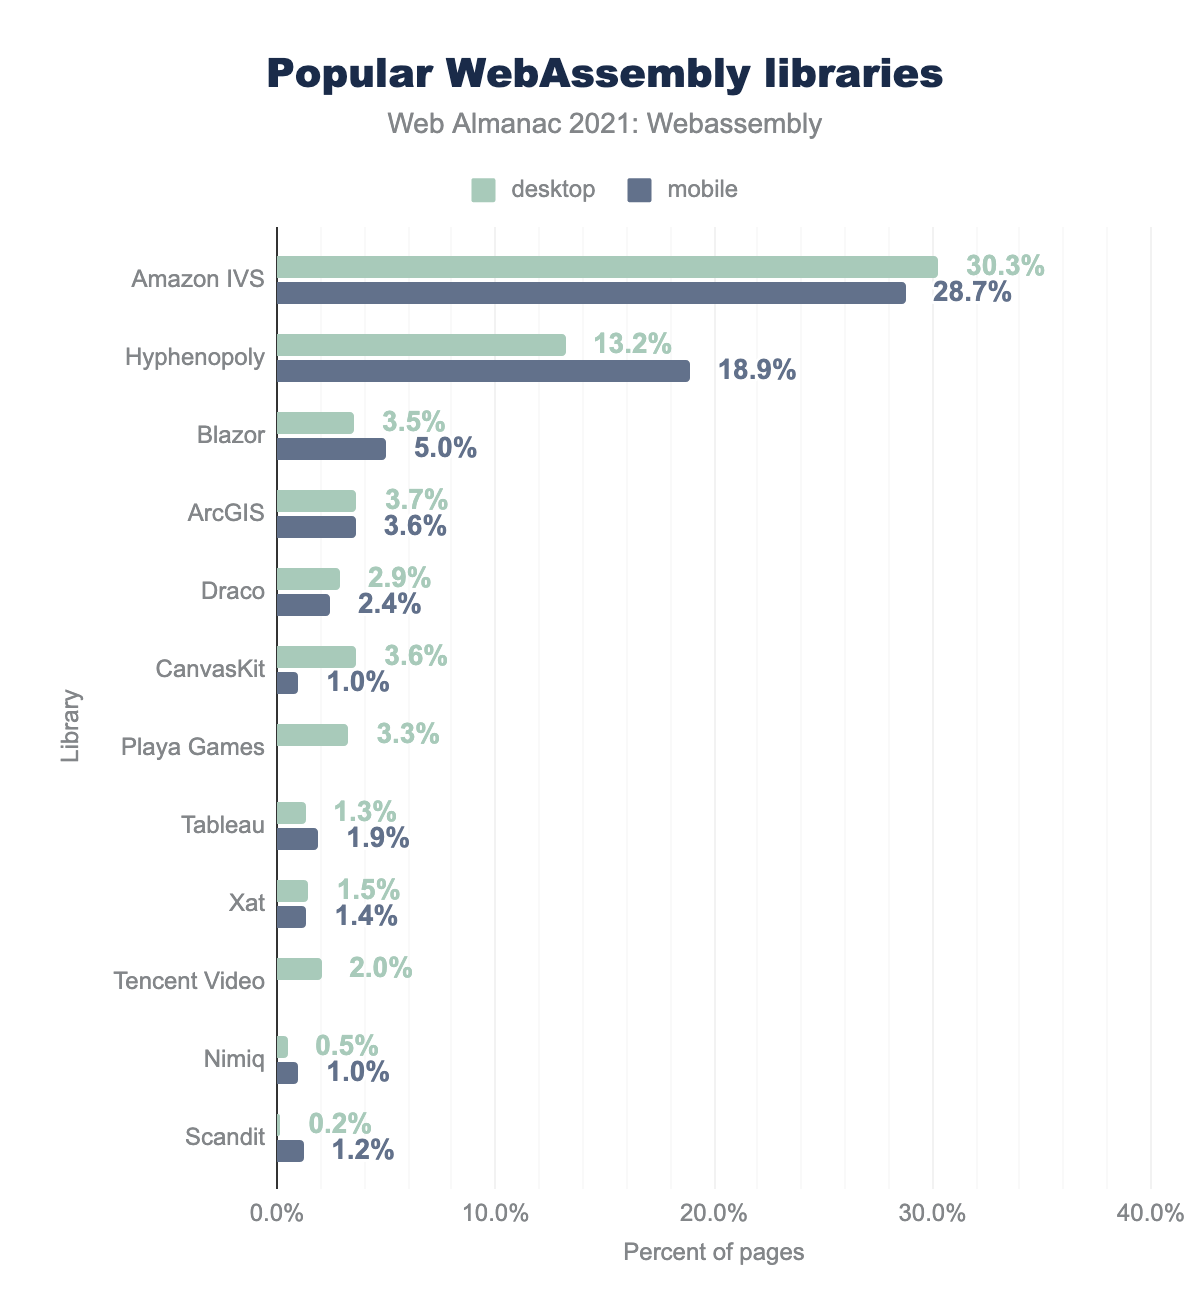
Almost a third of WebAssembly usages on both desktop and mobile belong to the Amazon Interactive Video Service player library. While it’s not open-source, the inspection of the associated JavaScript glue code suggests that it was built with Emscripten.
The next up is Hyphenopoly—a library for hyphenating text in various languages—that accounts for 13% and 19% of Wasm requests on desktop and mobile correspondingly. It’s built with JavaScript and AssemblyScript.
Other libraries from both top 10 desktop and mobile lists account for up to 5% of WebAssembly requests each. Here’s a complete list of libraries shown above, with inferred toolchains and links to corresponding home pages with more information:
- Amazon IVS (Emscripten)
- Hyphenopoly (AssemblyScript)
- Blazor (.NET)
- ArcGIS (Emscripten)
- Draco (Emscripten)
- CanvasKit (Emscripten)
- Playa Games (Unity via Emscripten)
- Tableau (Emscripten)
- Xat (Emscripten)
- Tencent Video (Emscripten)
- Nimiq (Emscripten)
- Scandit (Emscripten)
Few more caveats about the methodology and results here:
- Hyphenopoly loads dictionaries for various languages as tiny WebAssembly files, too, but since those are technically not separate libraries nor are they unique usages of Hyphenopoly itself, we’ve excluded them from the graph above.
- WebAssembly file from Playa Games seems to be used by the same game hosted across similarly-looking domains. We count those as individual usages in our query, but, unlike other items in the list, it’s not clear if it should be counted as a reusable library.
How much do we ship?
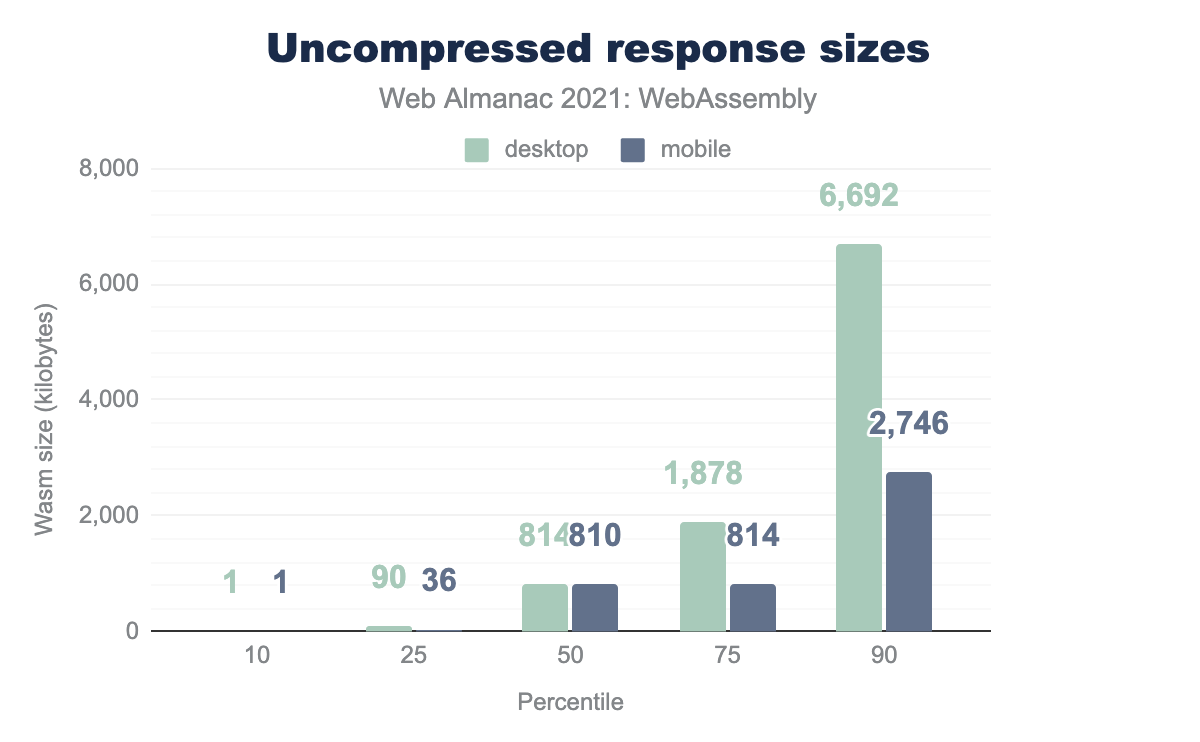
Languages compiled to WebAssembly usually have their own standard library. Since APIs and value types are so different across languages, they can’t reuse the JavaScript built-ins. Instead, they have to compile not only their own code, but also APIs from said standard library and ship it all together to the user in a single binary. What does it mean for the resulting file sizes? Let’s take a look:
The sizes vary a lot, which indicates a decent coverage of various types of content—from simple helper libraries to full applications compiled to WebAssembly.
We saw sizes of up to 81 MB at the most which may sound pretty concerning, but keep in mind those are uncompressed responses. While they’re also important for RAM footprint and start-up performance, one of the benefits of Wasm bytecode is that it’s highly compressible, and size over the wire is what matters for download speed and billing reasons.
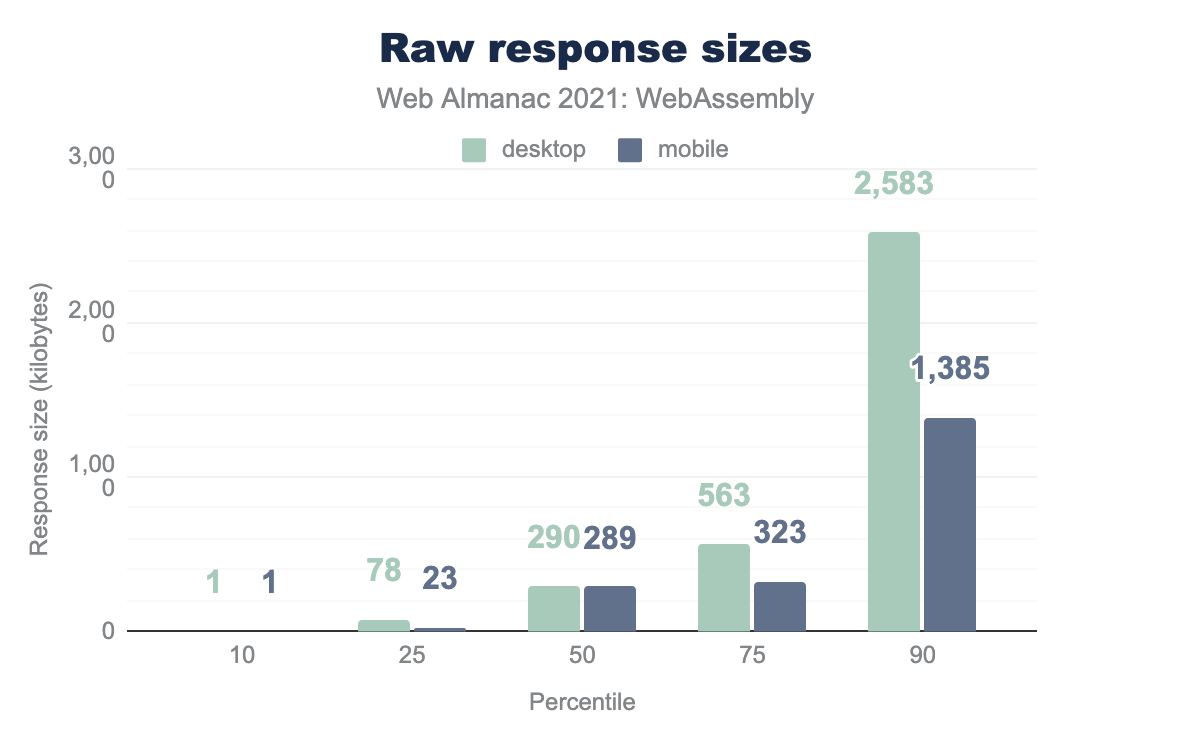
Let’s check sizes of raw response bodies as sent by servers instead:
The median is at around 290 KB, meaning that half of usages download below 290 KB, and half are larger. 90% of all Wasm responses stay below 2.6 MB on desktop and 1.4 MB on mobile.
The largest response in the HTTP Archive downloads about 44 MB of Wasm on desktop and 28 MB on mobile.
Even with compression, those numbers are still pretty extreme, considering that many parts of the world still don’t have a high-speed internet connection. Aside from reducing the scope of applications and libraries themselves, is there anything websites could do to improve those stats?
How is Wasm compressed in the wild?
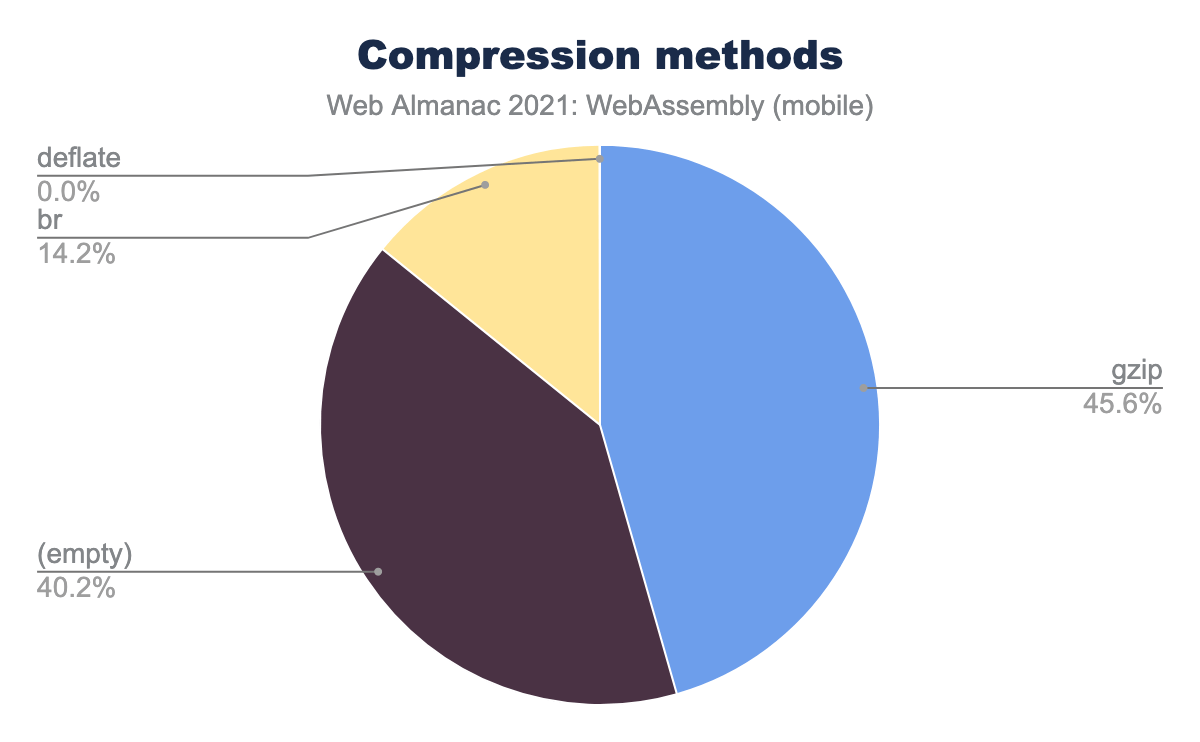
First, let’s take a look at compression methods used in these raw responses, based on Content-Encoding header. I’ll show the mobile dataset here because on mobile bandwidth is even more important, but desktop numbers are pretty similar:
Unfortunately, it shows that ~40% of WebAssembly responses on mobile are shipped without any compression.
Another ~46% use gzip, which has been a de-facto standard method on the web for a long time, and still provides a decent compression ratio, but it’s not the best algorithm today. Finally, only ~14% use Brotli—a modern compression format that provides an even better ratio and is supported in all modern browsers. In fact, Brotli is supported in every browser that has WebAssembly support too, so there’s no reason not to use them together.
Can we improve compression?
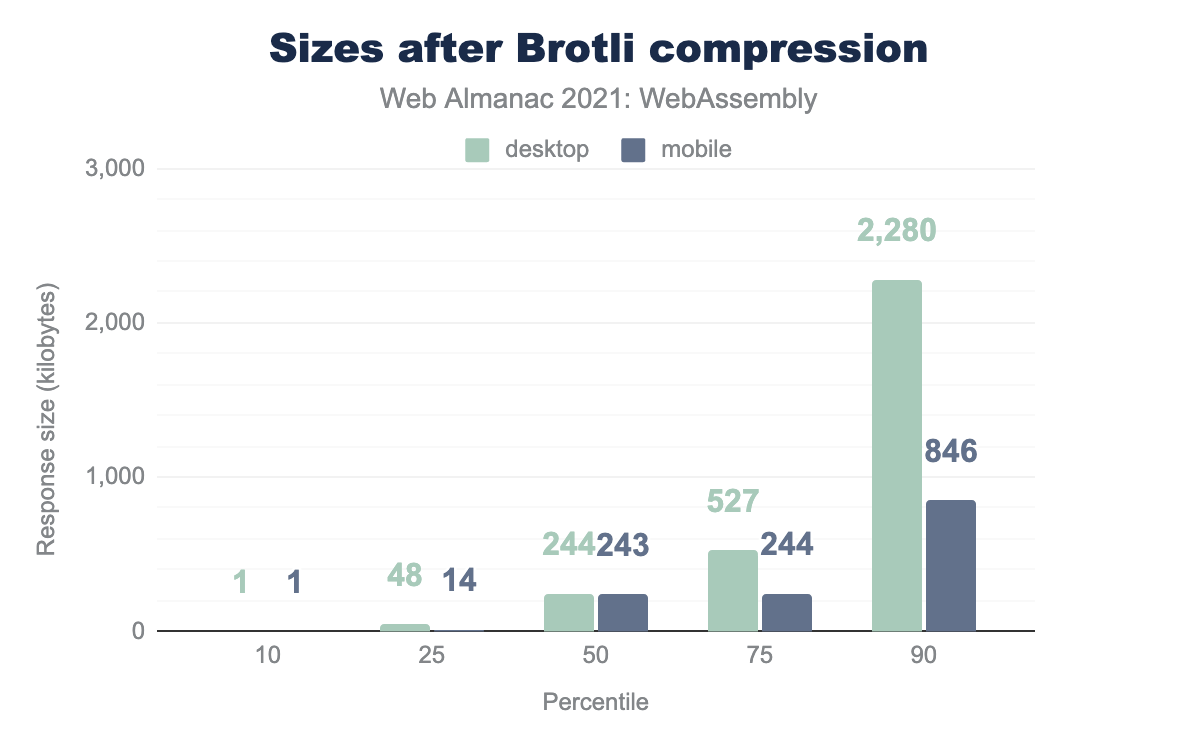
Would it have made a difference? We’ve decided to recompress all those WebAssembly files with Brotli (compression level 9) to figure it out. The command used on each file was:
brotli -k9f some.wasm -o some.wasm.brHere are the resulting sizes:
The median drops from almost 290 KB to almost 240 KB, which is already a pretty good sign. The top 10 percentiles go down from 2.5 MB / 1.4 MB to 2.2 MB / 0.8 MB. We can see significant improvements across all other percentiles, too.
Due to their nature, percentiles don’t necessarily fall onto the same files between datasets, so it might be hard to compare numbers directly between graphs and to understand the size savings. Instead, from now on, let’s see the savings themselves provided by each optimization, step by step:
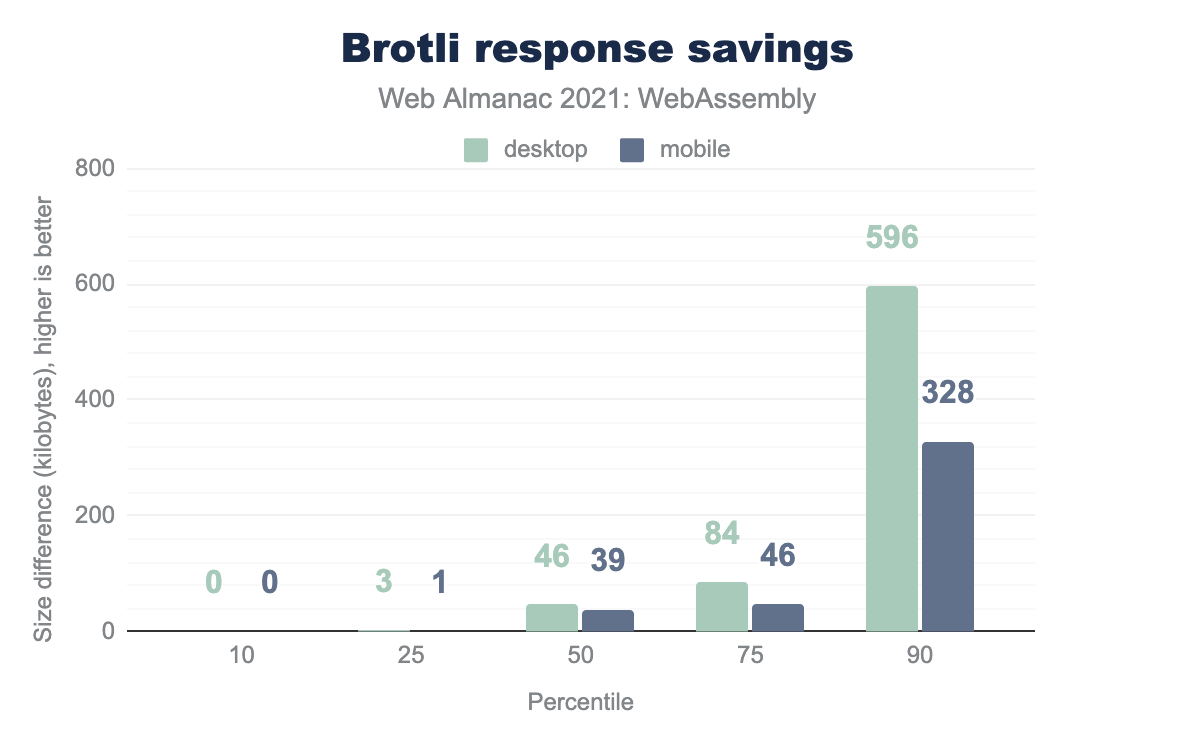
Median savings are around 40 KB. The top 10% save just under 600 KB on desktop and 330 KB on mobile. The largest savings produced reach as much as 35 MB / 21 MB. Those differences speak in favor of enabling Brotli compression whenever possible, at least for WebAssembly content.
What’s also interesting, at the other end of the graph—where we were supposed to see the worst savings—we found regressions of up to 1.4 MB. What happened there? How is it possible that Brotli recompression has made things worse for some modules?
As mentioned above, in this article we’ve used Brotli with compression level 9, but—and we’ll admit, we completely forgot about this until this article—it also has levels 10 and 11. Those levels produce even better results in exchange for a steep performance drop-off, as seen, for example, in Squash benchmarks. Such trade-off makes them worse candidates for the common on-the-fly compression, which is why we didn’t use them in this article and went for a more moderate level 9. However, website authors can choose to compress their static resources ahead of time or cache the compression results, and save even more bandwidth without sacrificing CPU time. Cases like these show up as regressions in our analysis, meaning resources can be and, in some cases, already were optimized even better than we did in this article.
Which sections take up most of the space?
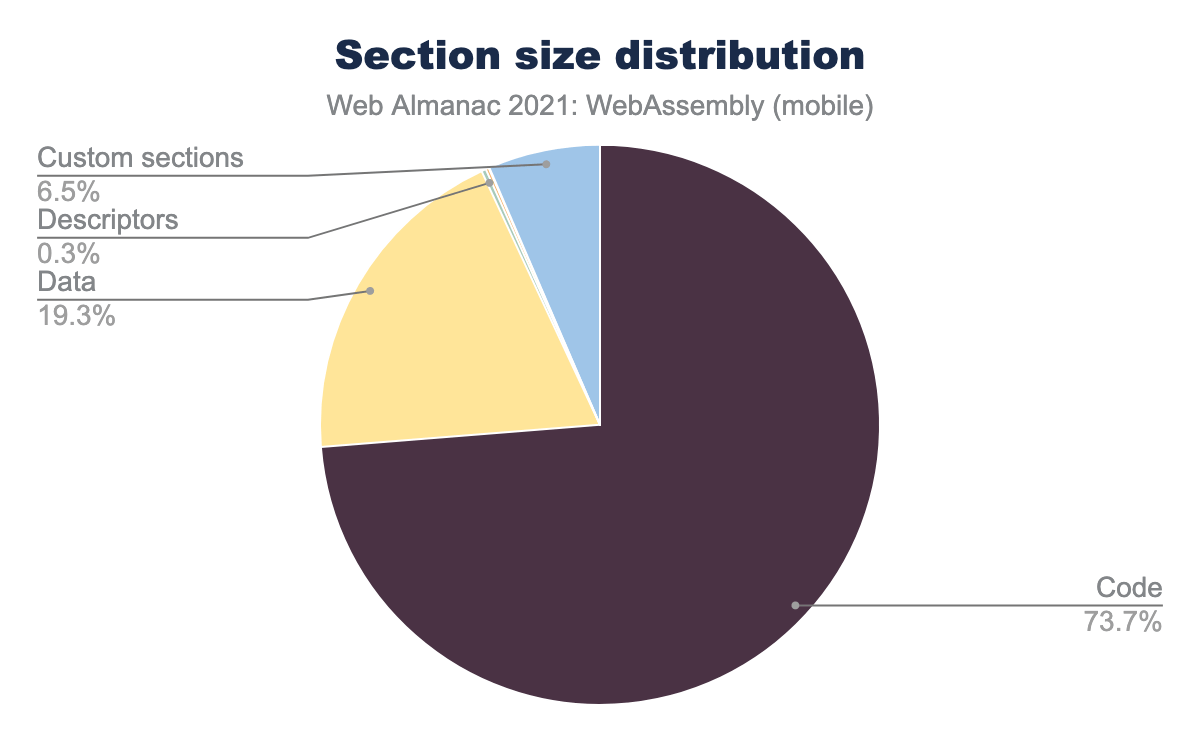
Compression aside, we could also look for optimization opportunities by analyzing the high-level structure of WebAssembly binaries. Which sections are taking up most of the space? To find out, we’ve summed up section sizes from all the Wasm modules and divided them by the total binary size. Once again, we used numbers from the mobile dataset here, but desktop numbers aren’t too far off:
Unsurprisingly, most of the total binary size (~74%) comes from the compiled code itself, followed by ~19% for embedded static data. Function types, import/export descriptors and such comprise a negligible part of the total size. However, one section type stands out—it’s custom sections, which account for ~6.5% of total size in the mobile dataset.
Custom sections are mainly used in WebAssembly for 3rd-party tooling—they might contain information for type binding systems, linkers, DevTools and such. While all of those are legitimate use-cases, they are rarely necessary in production code, so such a large percentage is suspicious. Let’s take a look at what they are in top 10 files with largest custom sections:
| URL | Size of Custom Sections | Custom Sections |
|---|---|---|
| …/dotnet.wasm | 15,053,733 | name |
| …/unity.wasm.br?v=1.0.8874 | 9,705,643 | name |
| …/nanoleq-HTML5-Shipping.wasmgz | 8,531,376 | name |
| …/export.wasm | 7,306,371 | name |
| …/c0c43115a4de5de0/…/northstar_api.wasm | 6,470,360 | name, external_debug_info |
| …/9982942a9e080158/…/northstar_api.wasm | 6,435,469 | name, external_debug_info |
| …/ReactGodot.wasm | 4,672,588 | name |
| …/v18.0-591dd9336/trace_processor.wasm | 2,079,991 | name |
| …/v18.0-615704773/trace_processor.wasm | 2,079,991 | name |
| …/canvaskit.wasm | 1,491,602 | name |
All of those are almost exclusively the name section which contains function names for basic debugging. In fact, if we keep looking through the dataset, we can see that almost all of those custom sections contain just the debug information.
How much can we save by stripping debug info?
While debug information is useful for local development, those sections can be hefty—they take over 14 MB before compression in the table above. If you want to be able to debug production issues users are experiencing, a better approach might be to strip the debug information out of the binary using llvm-strip, wasm-strip or wasm-opt --strip-debug before shipping, collect raw stacktraces and match them back to source locations locally, using the original binary.
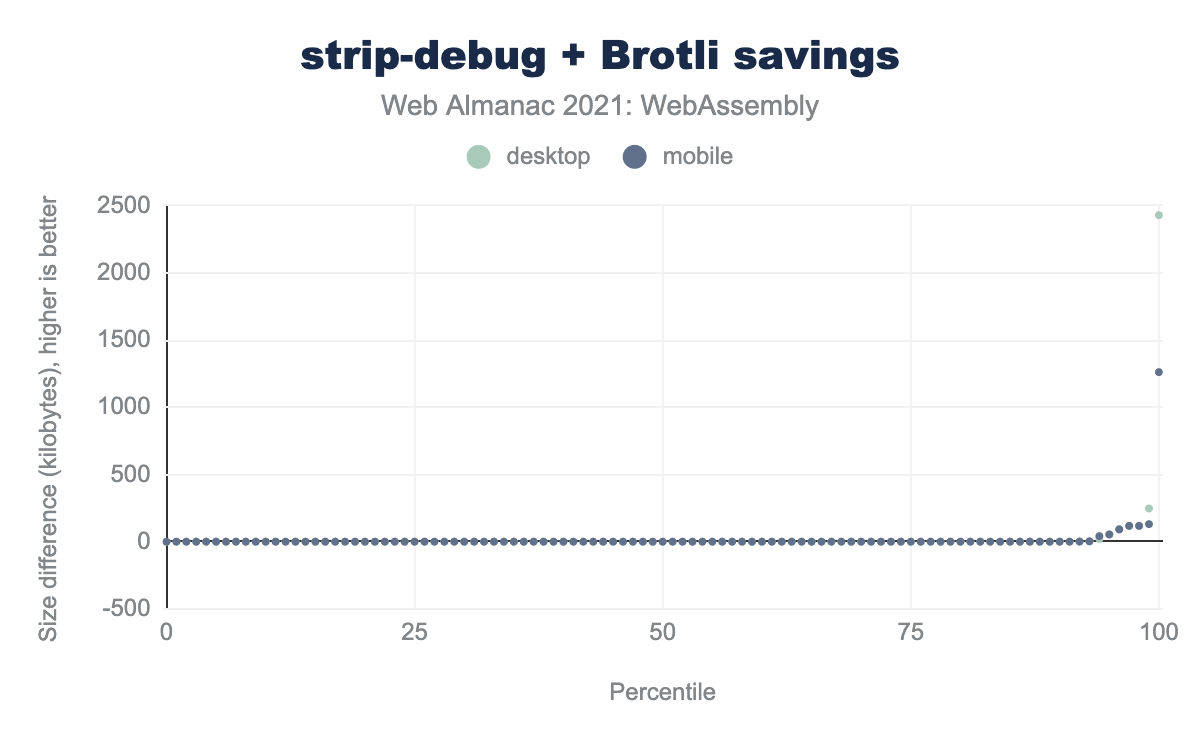
It would be interesting to see how much much stripping this debug information would save us in combination with Brotli, vs. just Brotli from the previous step. However, most modules in the dataset don’t have custom sections so any percentiles below 90 would be useless:
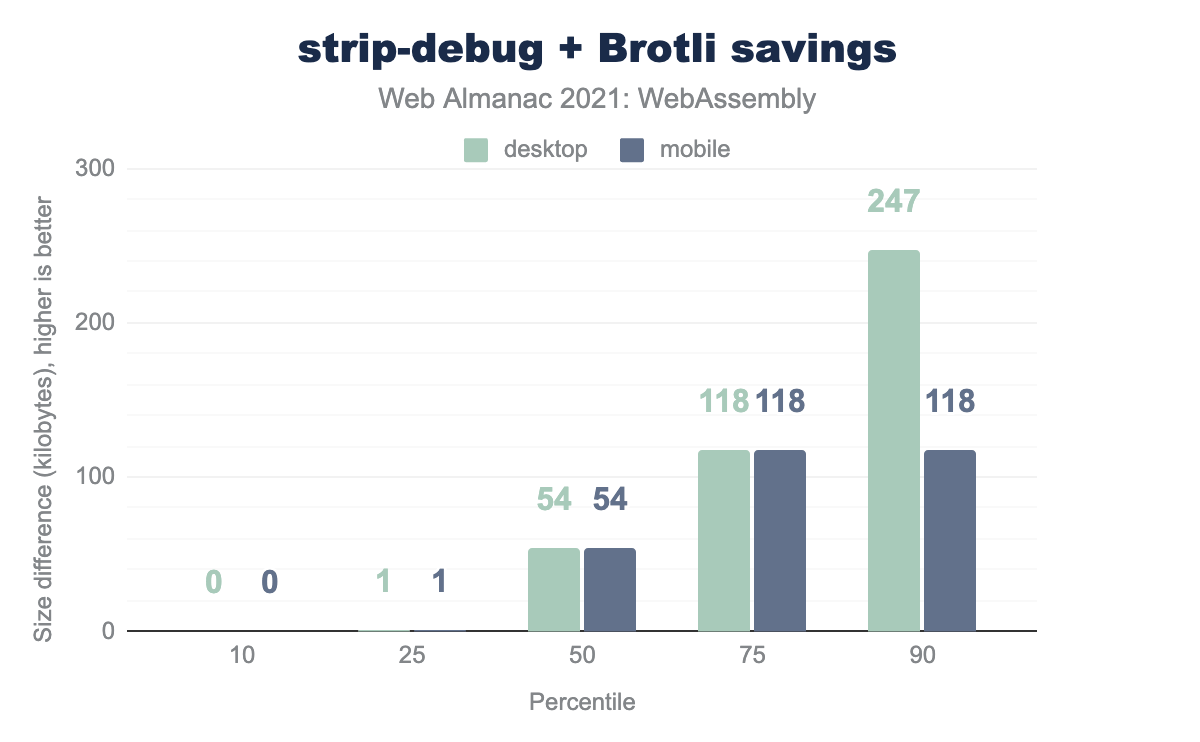
Instead, let’s take a look at the distribution of savings only over files that do have custom sections:
As can be seen from the graph, some file’s custom sections are negligibly small, but the median is at 54 KB and the 90 percentile is at 247 KB on desktop and 118 KB on mobile. The largest savings we could get were at 2.4 MB / 1.3 MB for the largest Wasm binaries on desktop and mobile, which is a pretty noticeable improvement, especially on slow connections.
You might have noticed that the difference is a lot smaller than raw sizes of custom sections from the table above. The reason is that the name section, as its name suggests, consists mostly of function names, which are ASCII strings with lots of repetitions, and, as such, are highly compressible.
There are a few outliers where the process of removing custom sections with llvm-strip made some changes to the WebAssembly module that made it smaller before compression, but slightly larger after the compression. Such cases are rare though, and the difference in size is insignificant compared to the total size of the compressed module.
How much can we save via wasm-opt?
wasm-opt from the Binaryen suite is a powerful optimization tool that can improve both size and performance of the resulting binaries. It’s used in major WebAssembly toolchains such as Emscripten, wasm-pack and AssemblyScript to optimize binaries produced by the underlying compiler.
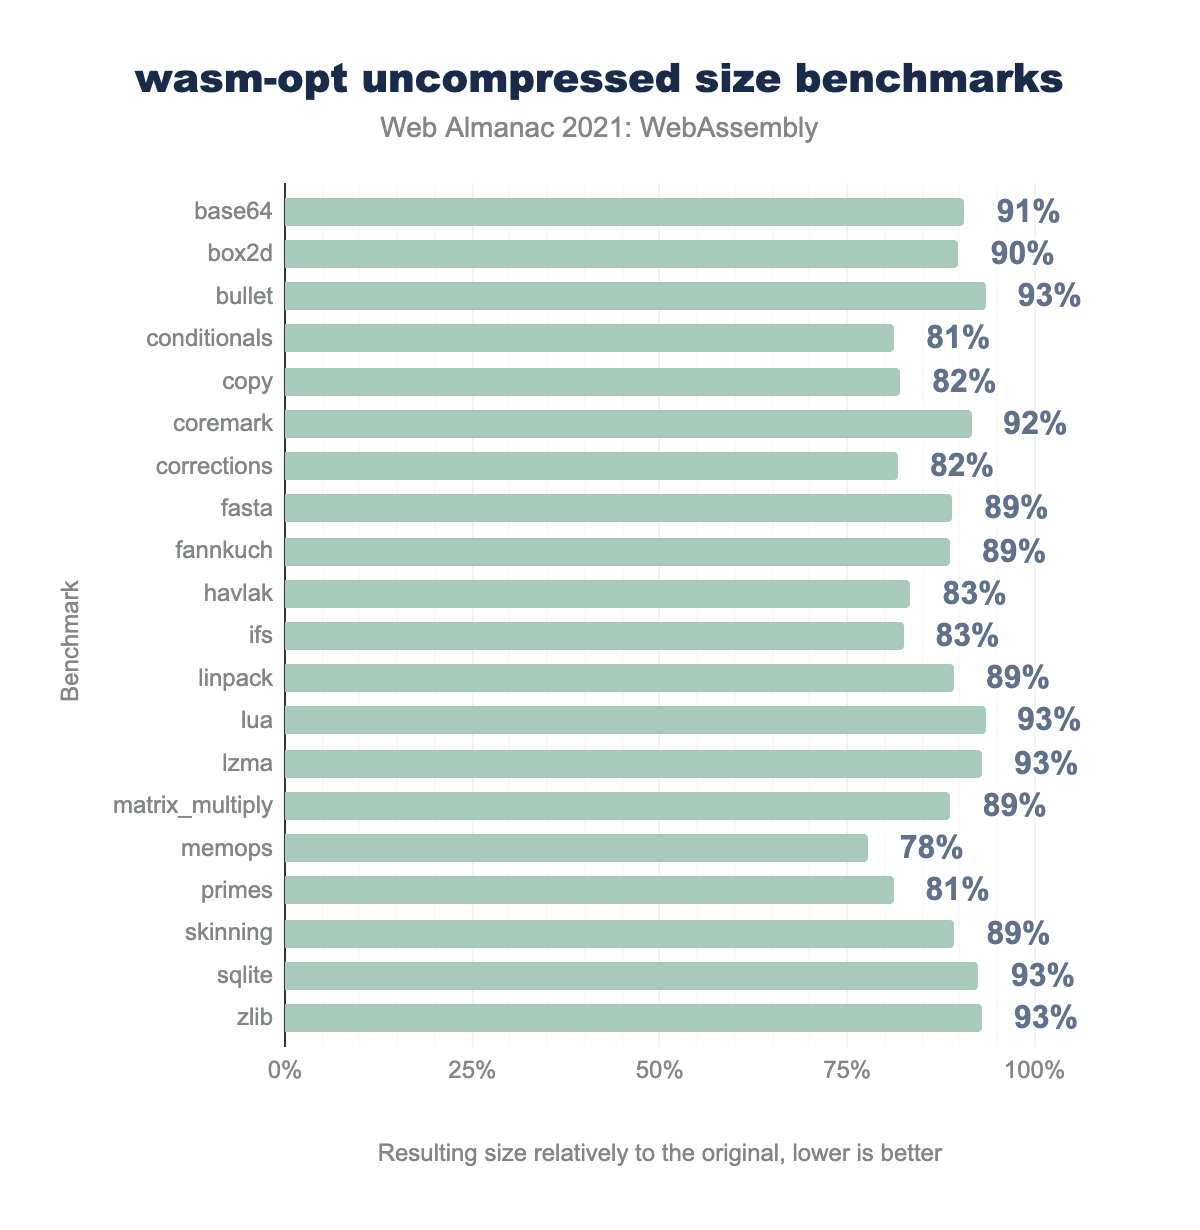
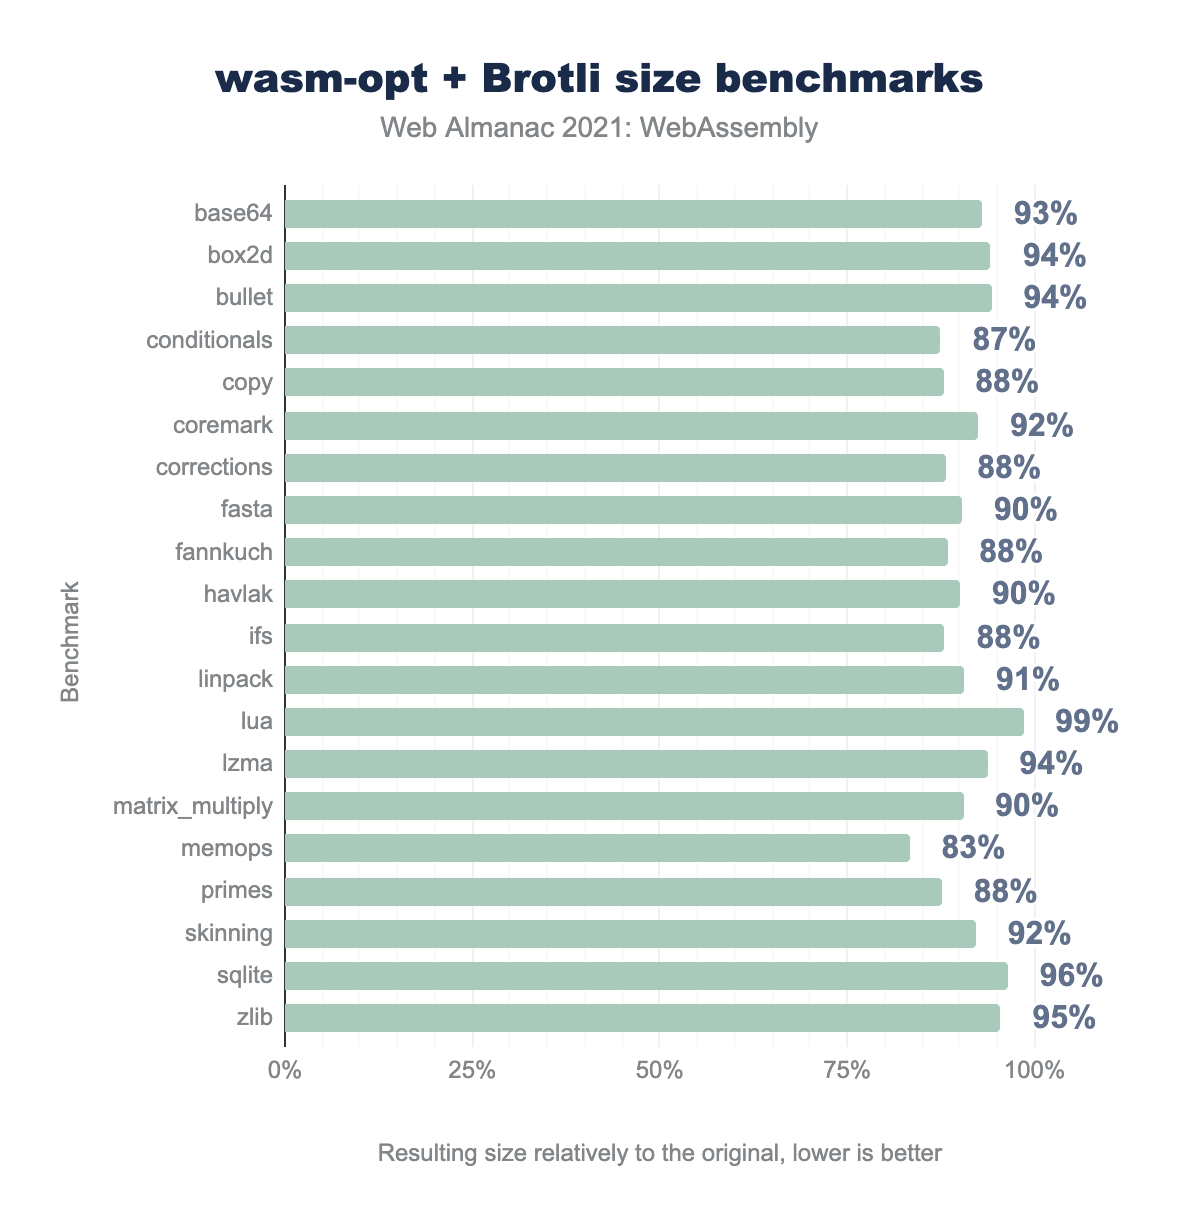
It provides significant size savings on both uncompressed and compressed real-world benchmarks:
wasm-opt size benchmarks across a wide variety of real-world modules such as base64, box2d, lua, sqlite, zlib, etc. The resulting sizes vary from 78% to, worst-case, 93% of the original. Median is at 89%.wasm-opt uncompressed size benchmarks.
wasm-opt size benchmarks, but with Brotli compression applied to both original and resulting WebAssembly modules. Results vary from 83% to 99% with median at 91%.wasm-opt + Brotli size benchmarks.
We’ve decided to check the performance of wasm-opt on the collected HTTP Archive dataset as well, but there’s a catch.
As mentioned above, wasm-opt is already used by most compiler toolchains, so most of the modules in the dataset are already its resulting artifacts. Unlike in compression analysis above, there’s no way for us to reverse existing optimizations and run wasm-opt on the originals. Instead, we’re re-running wasm-opt on pre-optimized binaries, which skews the results. This is the command we’ve used on binaries produced after the strip-debug step:
wasm-opt -O -all some.wasm -o some.opt.wasmThen, we compressed the results to Brotli and compared to the previous step, as usual.
While the resulting data is not representative of real-world usage and not relevant to regular consumers who should use wasm-opt as they normally do, it might be useful to consumers like CDNs that want to run optimizations at scale, as well as to the Binaryen team itself:
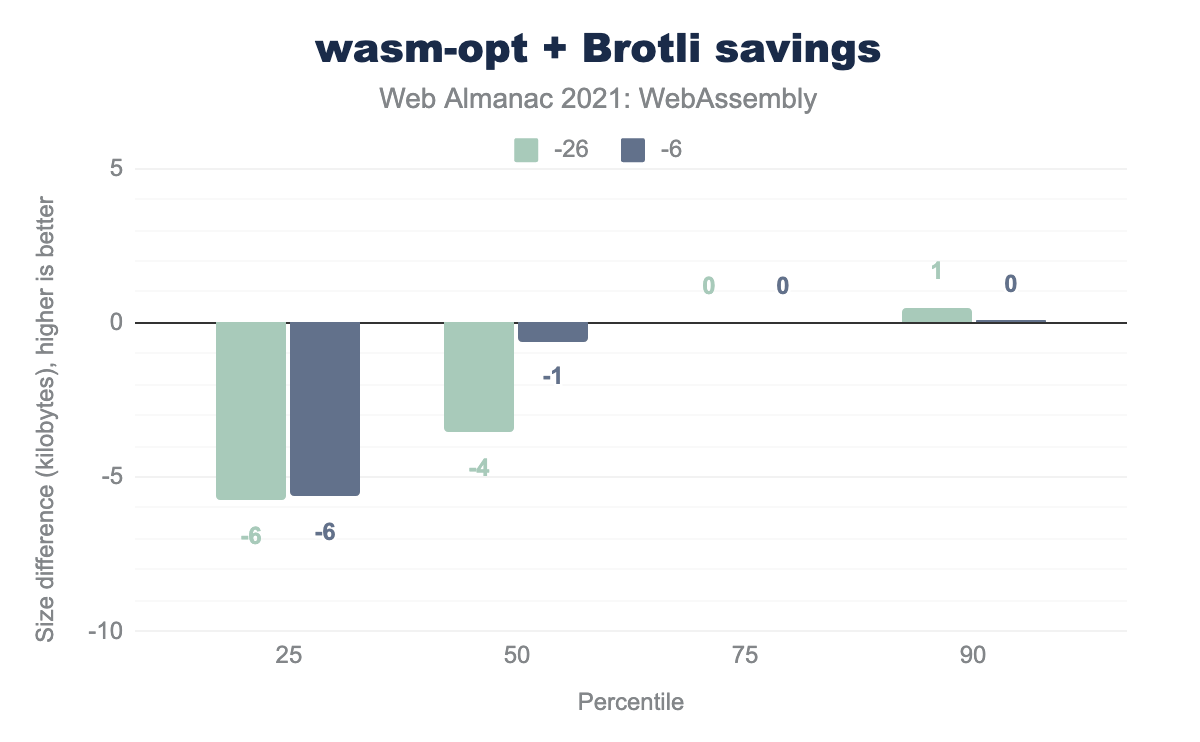
wasm-opt + Brotli are executed against our modified datasets. The results are mixed but leaning downwards—10percentiles shows 26 KB and 6 KB regressions on desktop and mobile correspondingly, median shows 4 KB and 1 KB regressions, and 90percentiles shows small improvements under 1 KB.wasm-opt + Brotli savings.
The results in the graph are mixed, but all changes are relatively small, up to 26 KB. If we included outliers (0 and 100 percentiles), we’d see more significant improvements of up to 1 MB on desktop and 240 KB on mobile on the best end, and regressions of 255 KB on desktop and 175 KB on mobile on the worst end.
The significant savings in a small percentage of files mean they were likely not optimized before publishing on the web. But why are the other results so mixed?
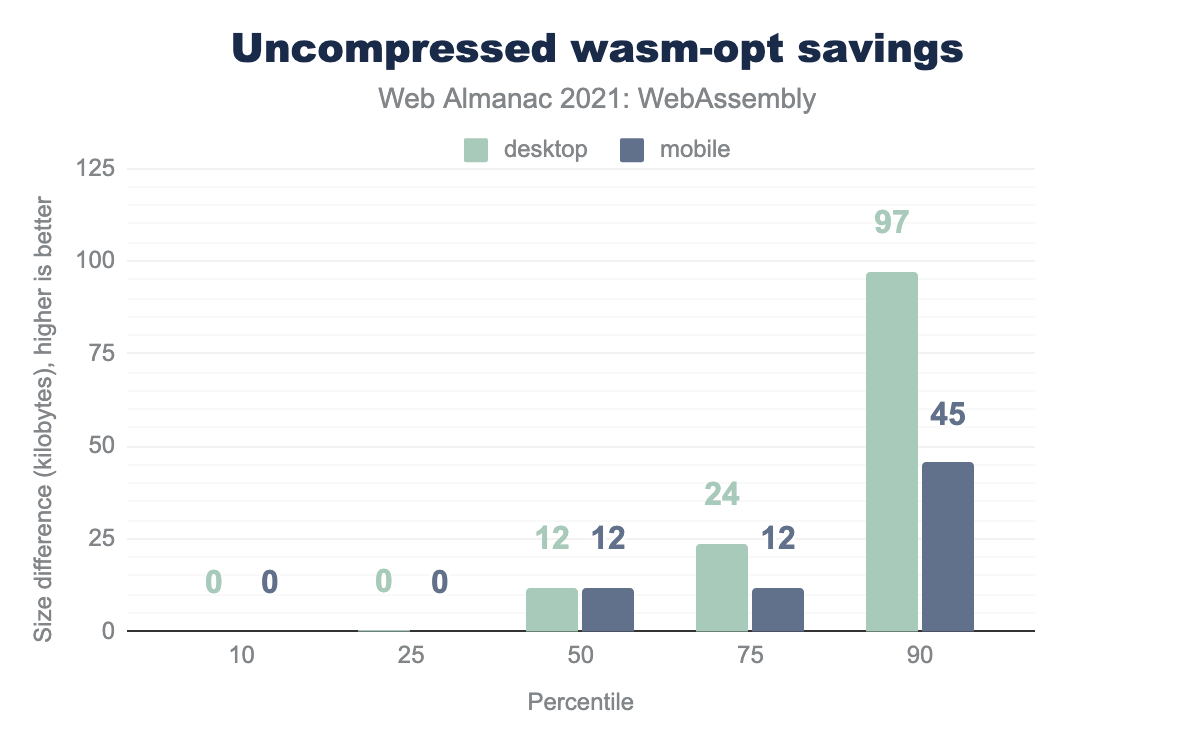
If we look at the uncompressed savings, it becomes more clear that, even on our dataset, wasm-opt consistently keeps files either roughly the same size or still improves size slightly further in majority of cases, and produces significant savings for the unoptimized files.
wasm-opt on the same datasets, but this time without Brotli. 10 percentiles and 25 percentiles shows an insignificant or no improvement of 0 kilobytes on desktop and mobile, median shows an improvement of 12 KB on both, 90percentiles shows improvements of almost 100 KB on desktop and 45 KB on mobile.wasm-opt savings.
This suggests several reasons for the surprising distribution in the post-compression graph:
- As mentioned above, our dataset does not resemble real-world
wasm-optusage as the majority of the files have been already pre-optimized bywasm-opt. Further instruction reordering that improves uncompressed size a bit further, is bound to make certain patterns either more or less compressible than others, which, in turn, produces statistical noise. - We use default
wasm-optparameters, whereas some users might have tweakedwasm-optflags in a way that produces even better savings for their particular modules. - As mentioned earlier, the network (compressed) size is not everything. Smaller WebAssembly binaries tend to mean faster compilation in the VM, less memory consumption while compiling, and less memory to hold the compiled code.
wasm-opthas to strike a balance here, which might also mean that the compressed size might sometimes regress in favor of better raw sizes. - Finally, some of the regressions look like potentially valuable examples to study and improve that balance. We’ve reported them back to the Binaryen team so that they could look deeper into potential optimizations.
What are the most popular instructions?
We’ve already glimpsed at the contents of Wasm when sliced by section kinds above. Let’s take a deeper look at the contents of the code section—the largest and the most important part of a WebAssembly module.
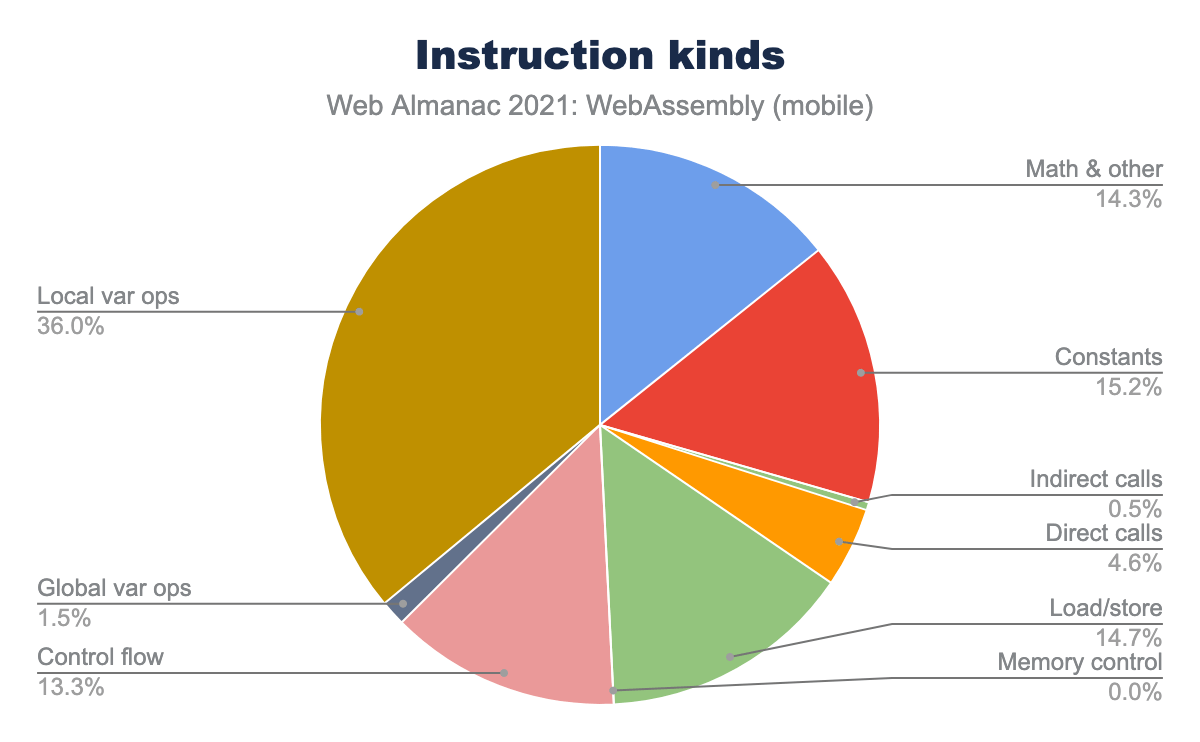
We’ve split instructions into various categories and counted them across all the modules together:
One surprising takeaway from this distribution is that local var operations—that is, local.get, local.set and local.tee—comprise the largest category—36%, far ahead from the next few categories—inline constants (15.2%), load/store operations (14.7%) and all the math and logical operations (14.3%). Local var operations are usually generated by compilers as a result of optimization passes in compilers. They downgrade expensive memory access operations to local variables where possible, so that engines can subsequently put those local variables into CPU registers, which makes them much cheaper to access.
It’s not actionable information for developers compiling to Wasm, but something that might be interesting to engine and tooling developers as a potential area for further size optimizations.
What’s the usage of post-MVP extensions?
Another interesting metric to look at is post-MVP Wasm extensions. While WebAssembly 1.0 was released several years ago, it’s still actively developed and grows with new features over time. Some of those improve code size by moving common operations to the engines, some provide more powerful performance primitives, and others improve developer experience and integration with the web. On the official feature roadmap we track support for those proposals across latest versions of every popular engine.
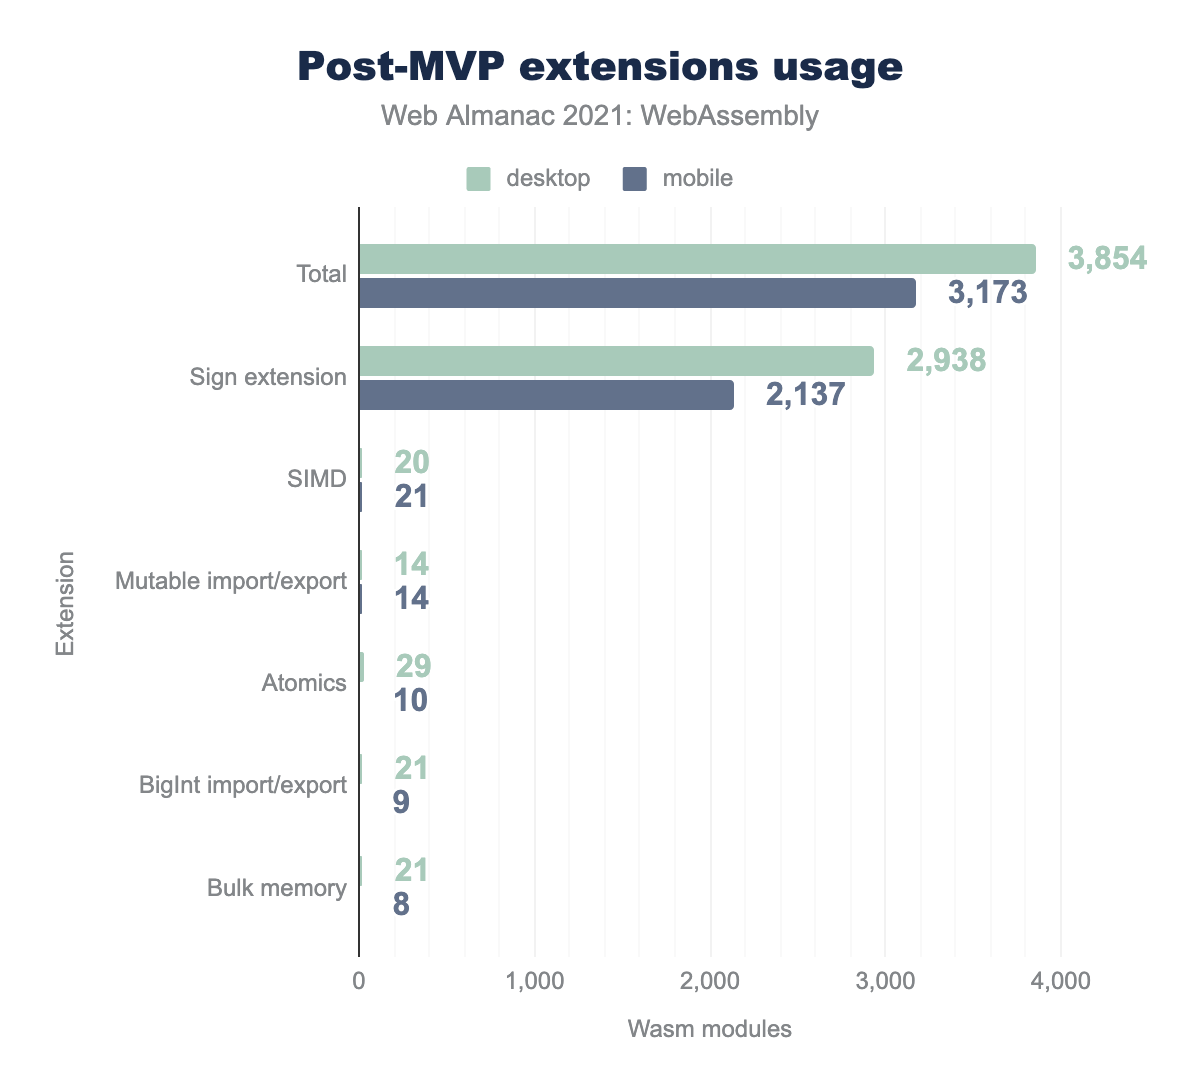
Let’s take a look at their adoption in the Almanac dataset too:
One feature stands out—it’s the sign-extension operators proposal. It was shipped in all browsers not too long after the MVP, and enabled in LLVM (a compiler backend used by Clang / Emscripten and Rust) by default, which explains its high adoption rate. All other features currently have to be enabled explicitly by the developer at compilation time.
For example, non-trapping float-to-int conversions is very similar in spirit to sign-extension operators—it also provides built-in conversions for numeric types to save some code size—but it became uniformly supported only recently with the release of Safari 15. That’s why this feature is not yet enabled by default, and most developers don’t want the complexity of building and shipping different versions of their WebAssembly module to different browsers without a very compelling reason. As a result, none of the Wasm modules in the dataset used those conversions.
Other features with zero detected usages—multi-value, reference types and tail calls—are in a similar situation: they could also benefit most WebAssembly use-cases, but they suffer from incomplete compiler and/or engine support.
Among the remaining, used, features, two that are particularly interesting are SIMD and atomics. Both provide instructions for parallelizing and speeding up execution at different levels: SIMD allows to perform math operations on several values at once, and atomics provide a basis for multithreading in Wasm. Those features are not enabled by default, require specific use-cases, and multithreading in particular requires using special APIs in the source code as well as additional configuration to make the website cross-origin isolated before it can be used on the web. As a result, a relatively low usage level is unsurprising, although we expect them to grow over time.
Conclusion
While WebAssembly is a relatively new and somewhat niche participant on the web, it’s great to see its adoption across a variety of websites and use-cases, from simple libraries to large applications.
In fact, we could see that it integrates so well into the web ecosystem, that many website owners might not even know they already use WebAssembly—to them it looks like any other 3rd-party JavaScript dependency.
We found some room for improvement in shipped sizes which, through further analysis, appears to be achievable via changes to compiler or server configuration. We’ve also found some interesting stats and examples that might help engine, tooling and CDN developers to understand and optimize WebAssembly usage at scale.
We’ll be tracking those stats over time and return with updates in the next edition of the Web Almanac.
